
That Was the Week That Was
If you have ever built anything in CRM Analytics, you have certainly put together a nice chart with a date along the X-Axis and some relevant metric along the Y-Axis. It is an incredibly basic technique, and CRMA helpfully allows you to slice the date in a bunch of different ways. For example, you can look at data year-over-year.
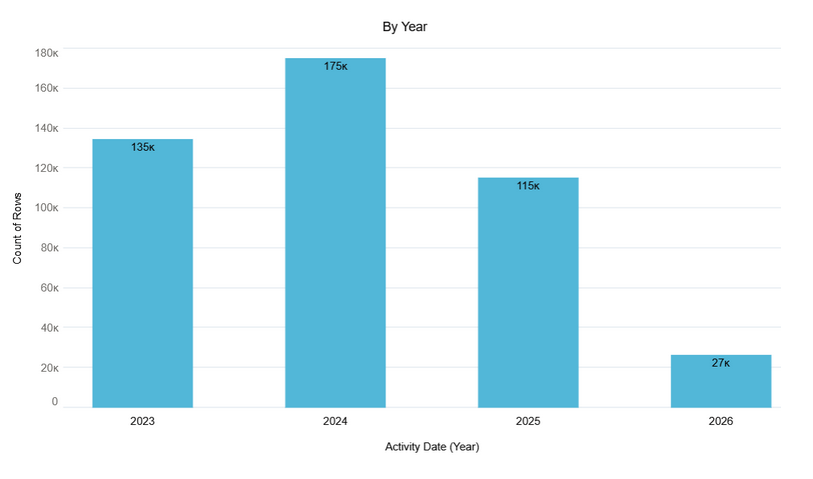
By Year Chart, with Years Along X-Axis
Or you can compare the data by Year-Month. Or you can do it by Year-Quarter if your business measures things in Quarters. Heck, you can even divide it by Month if you want to compare January to February.
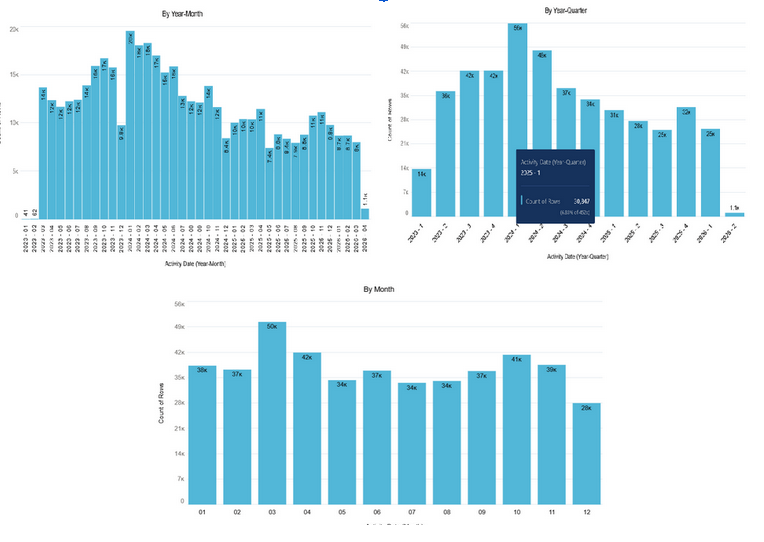
A collage of Charts showing By Year-Month, By Year-Quarter and By Month Along the X-Axis
All of these dates are easy to configure and easy to understand at a glance. Well, almost all of these dates. We need to talk about what happens when you use the Week option.
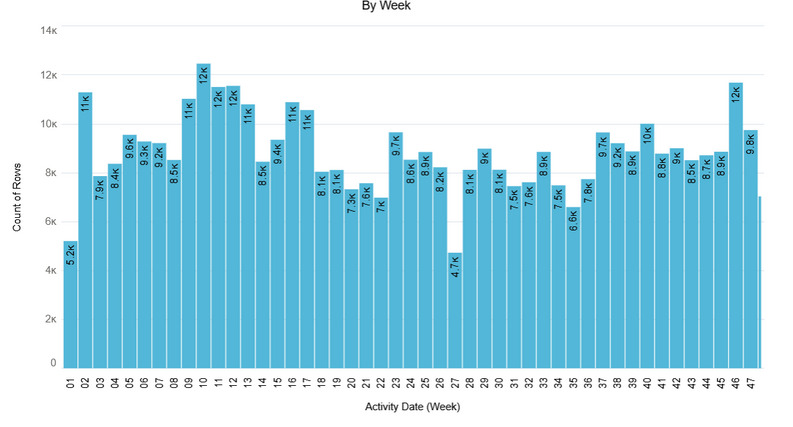
By Week Chart, with unhelpful Week numbers along X-Axis
So we divide by Week, and we can get from 1 to 52 along the axis. That’s fine, I guess, but if I tell you to look at week 19, how many people instantly know that week 19 is in May? For that matter, is Week 1 the first full week of the year (e.g., the week starting January 4 for 2026) or is the first week that has any day in it of the year (e.g., the week starting January 1 for 2026)? Can you answer that question without looking it up? Can your users? And by the way, do you need the first day of the week to be Sunday or Monday? Sadly, if you want to go week-by-week, the week number with all its potential confusion is the only out of the box option available.
Good news! As skilled CRMA administrators, we don’t have to stay in the box!. Since all my example charts use Activity Date for the X-Axis, we are going to create a brand new Text field called “First Day of Activity Week”. And even better news, this formula is dead simple. Here it is:
string(date_sub(ActivityDate, dayofweek(ActivityDate)-1))
We are taking the Activity Date and then finding the Sunday prior to that Activity Date. In other words, if the Activity Date is Saturday, May 9, we want the First Day of Activity Week to be Sunday, May 3. Let’s break down the steps.
dayofweek(ActivityDate) returns 1 for Sunday, 2 for Monday etc. For math purposes we want to be 0-indexed, so we subtract 1.
With that calculation handled, use date_sub() to subtract the zero-indexed dayofweek() from the Activity Date to give us the First Day of the Activity Week.
Then we use string() to cast it all to Text. Why Text? Because if we use Date Time for the field, we’ll still get a Week #. If we use Text, it will LOOK like a date but will still slice the way we want. Behold!
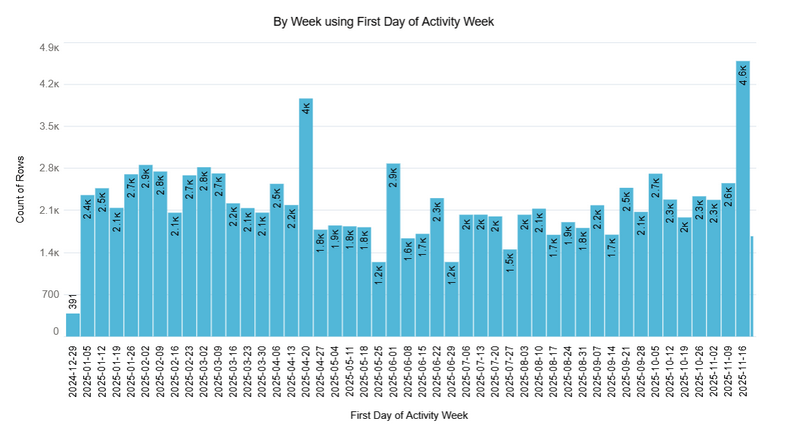
By Week chart, with useful dates along X-Axis
This is a lot easier to read. We know exactly what day the week starts because it is right there on the axis, and of course we know where in the year that week is too. This is a major usability improvement over the default Week #.
You should tweak this function for your own needs. In our example, the First Day of the Activity Week is a Sunday, but if you need the first day of your week to be the first Monday or Saturday or whatever, you can tweak the formula. Since it’s a Text field, you could even prepend ‘Sunday’ or ‘Su’ or name the field something like “Sunday of Activity Week” to make it even clearer to your end users. And of course, if your date might be null you will probably want to build some null checking into the equation or filter out nulls in your chart.
For the price of one new field, you can avoid the unintuitive out of the book Week # and make it much easier for your end users to look back at the data by Week.
